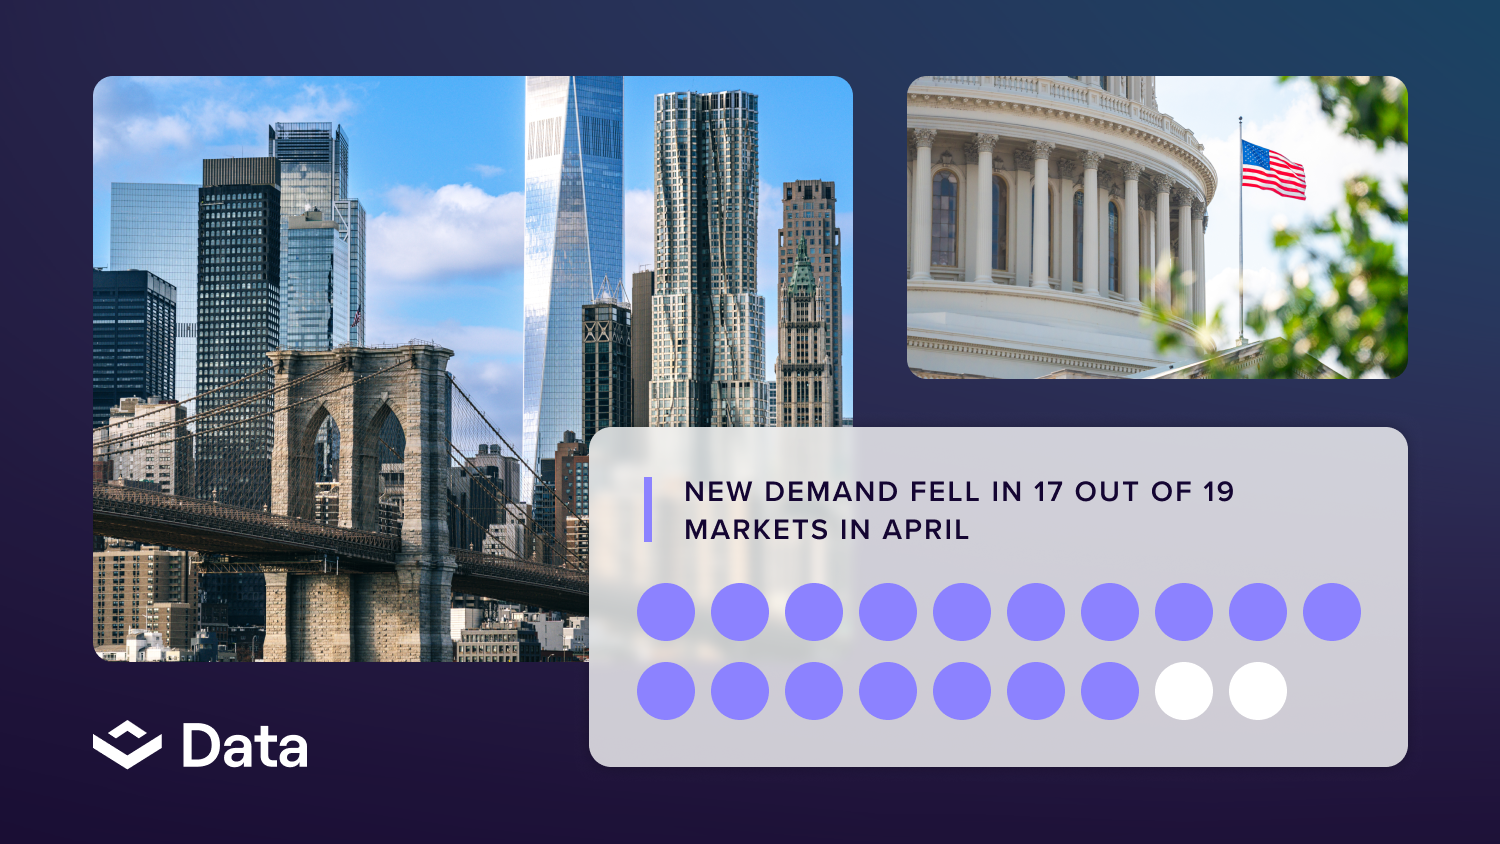
The pandemic has and will continue to impact long-term market dynamics of the office sector, especially as many companies continue to adopt hybrid and work-from-home models. Despite these changes in work models presented by the pandemic, new data from VTS' New Green Shoots Report shows office demand is beginning to trend upward after a slow start to the year.
As the prevalence of the Omicron variant waned in February of 2022, New Requirement Velocity (new requirements for office space as new tenants enter the market) is up from the seasonal December slowdown by 42% for sf and 54% for the count of new tenants entering the major U.S. markets. Though the velocity of New Requirements remains below pre-covid levels, demand (sf) in Q1 2022 is up 27.2% on average over Q1 2021 across the major U.S. office markets.
There are a few key trends that can be noted from this data:
- FIRE is recovering the fastest. FIRE’s share of overall demand has recovered to or surpassed pre-COVID levels in 6 of 8 markets tracked by VTS (DC & SF are the exceptions).
- Elevated concessions but rents hold. Landlords have upped concessions rather than dropping rents, which have actually increased 3.3% across VTS markets for Class A properties when comparing active proposals to 2019 executed leases.
- Upsizing large requirements yet small tenants touring. When looking at the trailing three month count of New Requirements vs. January and February 2020 baselines, smaller tenants (<10k sf) declined the least (-38%), followed by large (50k+ sf; -49%) and mid-size tenants (10-50k sf; -51%). The opposite is true when looking at demand on a square footage basis - large tenants lead and small tenants lag.
- More touring in low remote markets. The average VODI in Q1 22’ is much closer to ‘18 -‘19 averages in low remote work markets (NYC, HOU, LA, CHI) compared to high remote work markets.
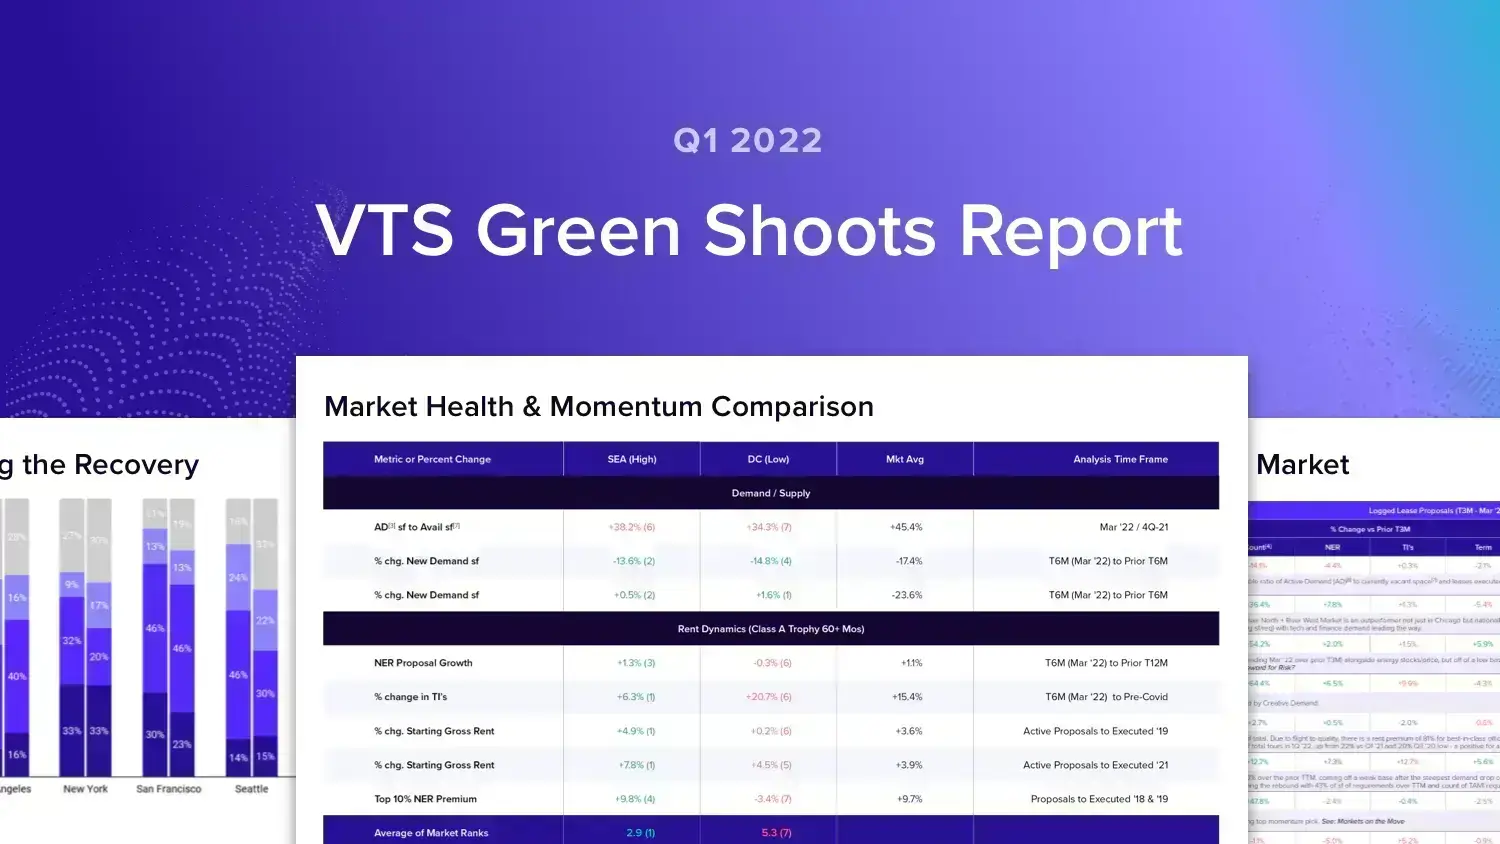
Standout Statistics By Market
The table below illustrates recent trends around tenant demand and deal economics, including volume, rent, concessions, and term. Combined with the VTS Office Demand Index (VODI), VTS proposal data is a reliable indicator of rates and leasing activity expected over the next two quarters.
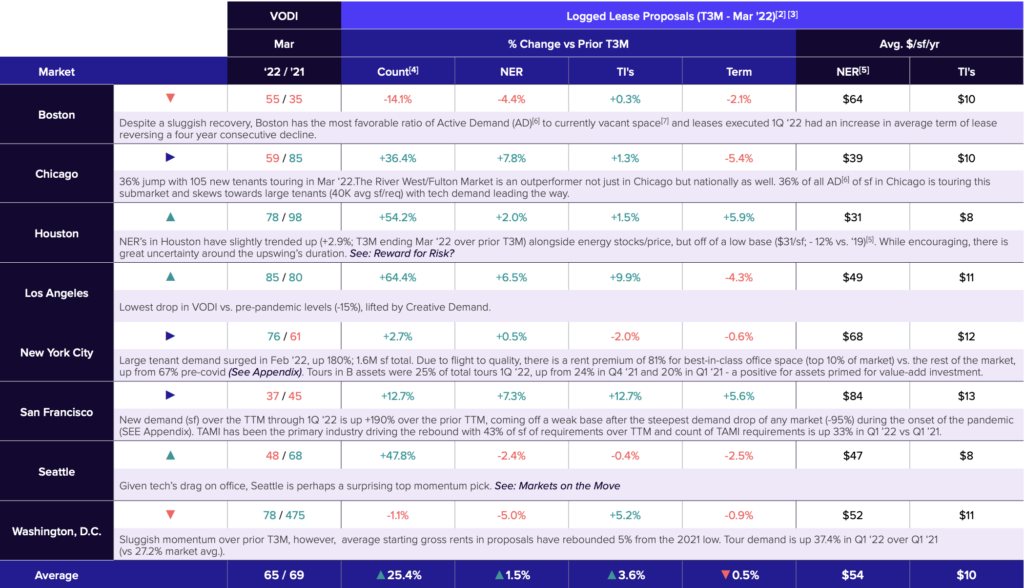
Key Findings:
- In New York City, large tenant demand surged in Feb 2022, up by 180%.
- Los Angeles displayed the lowest drop in VODI compared to pre-pandemic levels.
- Despite a sluggish recovery, Boston has the most favorable ratio of active demand to currently vacant space and leases executed in Q1 ‘22 had an increase in average term of lease, reversing a four-year consecutive decline.
- Seattle had the largest percent increases in VODI sf for both T3M (+49%) and T6M (+87%) averages over prior periods as evidence of strong tenant demand to date.
- The non-core Seattle CBD submarket group, driven by Lake Union, is one of only six VTS submarkets with double-digit T3M demand growth (+10%) vs. January and February of 2020, as measured by count of tenants, behind only Midtown South in New York City (+79%).
Want access to the full picture? The VTS Green Shoots Report is an exclusive look at what high-performing markets are doing to stay competitive. Download the full report to see how your business compares to industry leaders in CRE.